Featured project
Local P&ID
analyzer
Problem
Engineering documentation was manual. It took forever, and it kept our team from doing the engineering work we were actually there to do.
Solution
A local, automated P&ID analyzer for instrumentation engineers. It reads the drawing and writes the deliverables — running entirely on-premise.
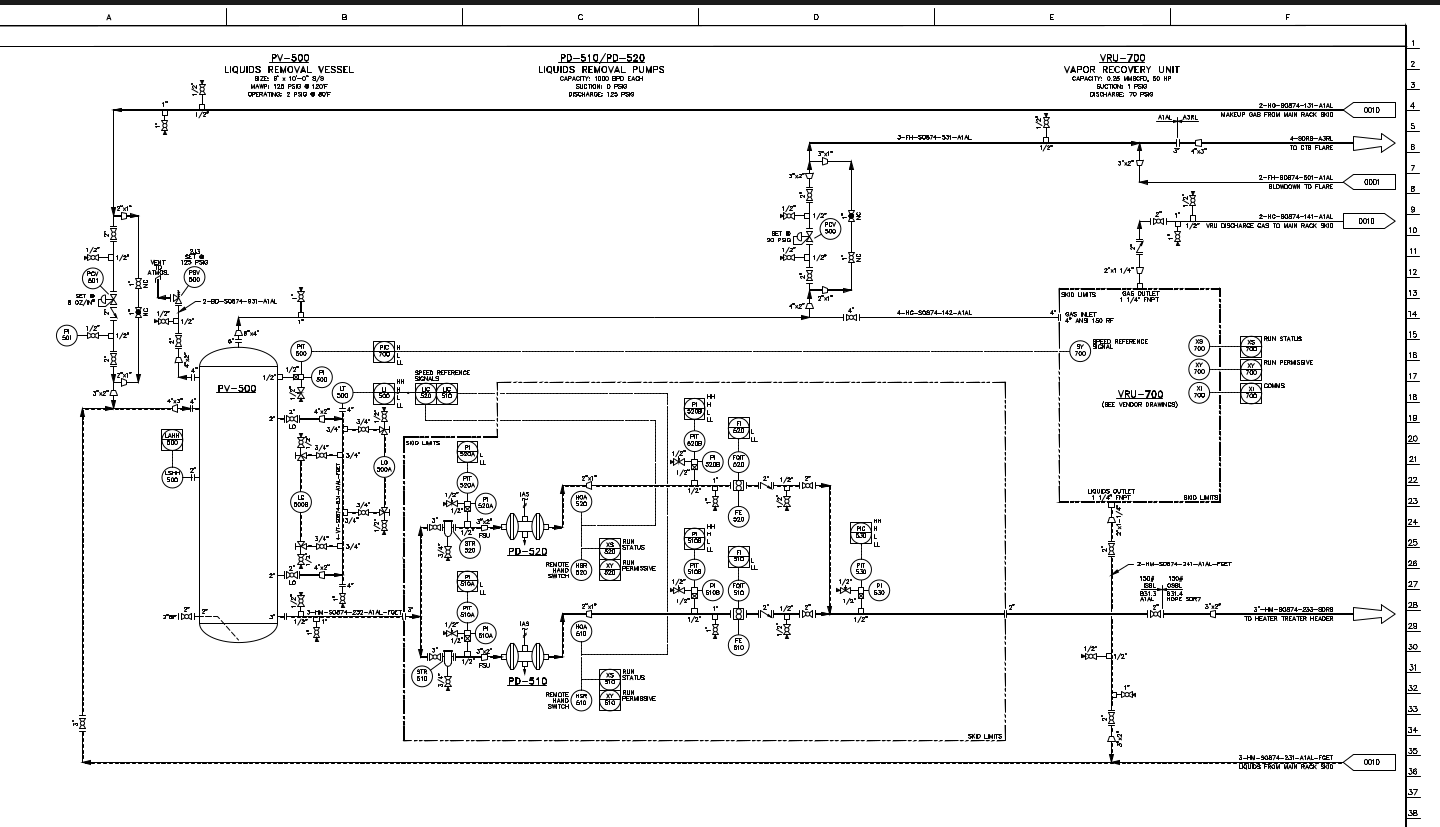
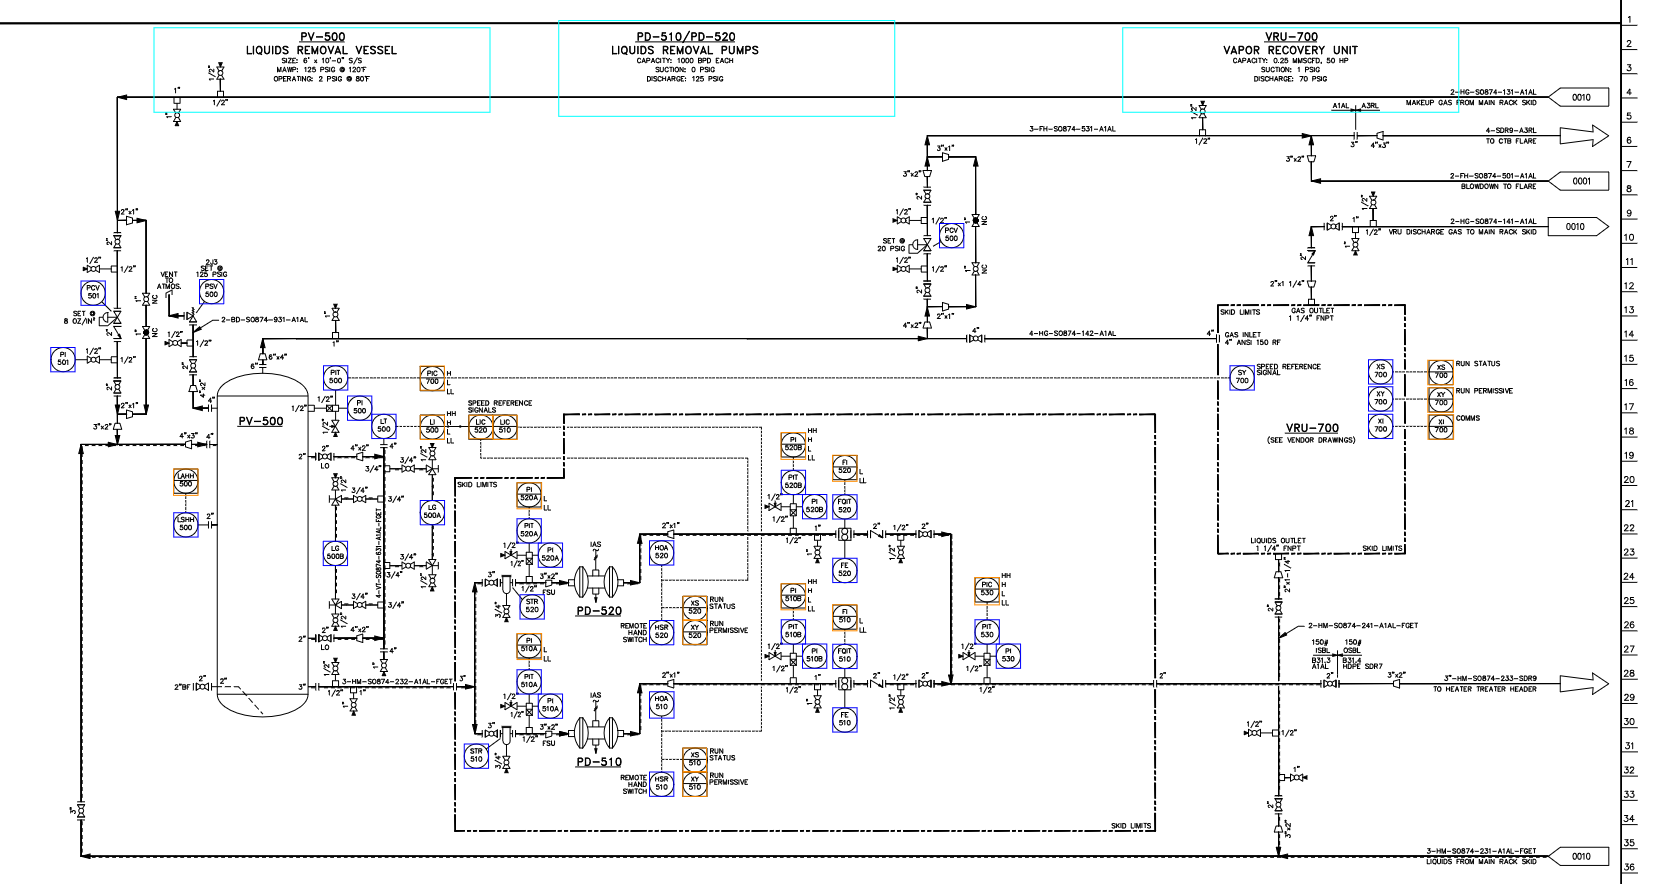
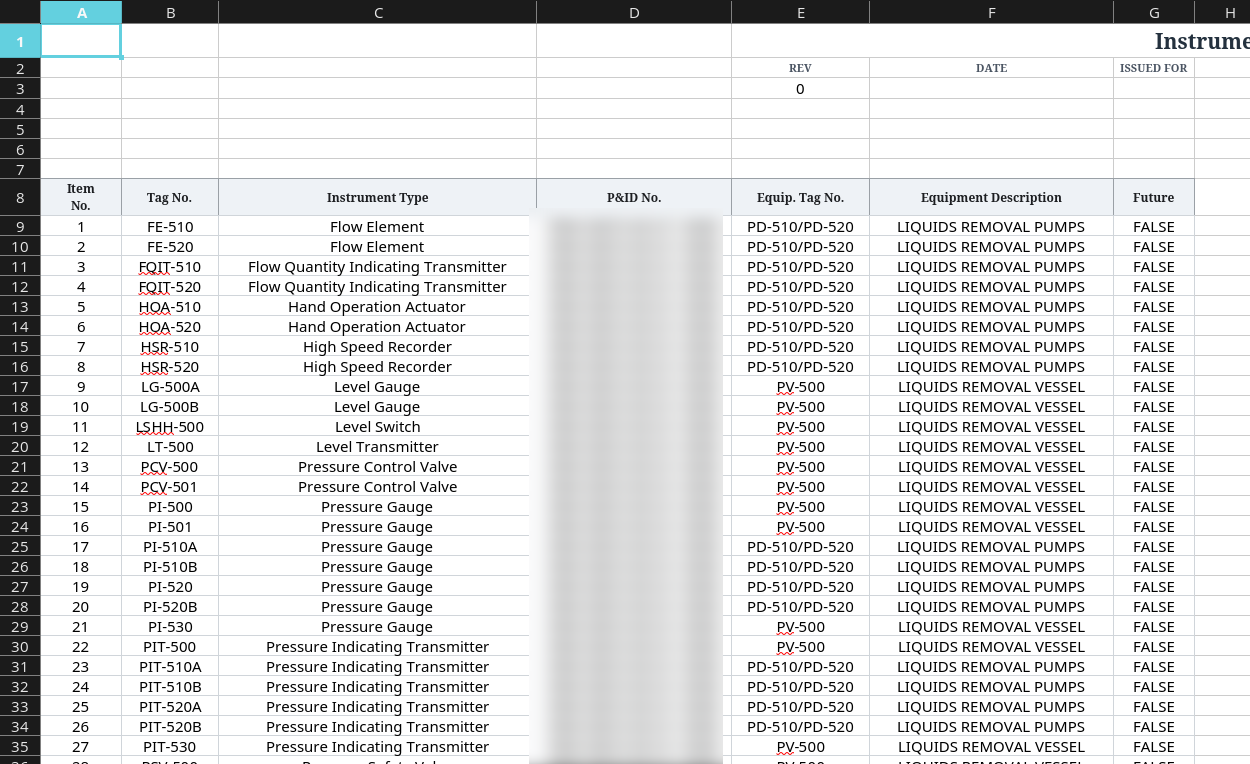
The pipeline runs in parallel with the engineer's work instead of blocking it. When it finishes, their role has changed from producing a document to validating one — which is a considerably better use of an engineer.
The details
Constraints
Two constraints shaped every decision that followed, and they're the reason the obvious approach wasn't the right one.
- The hardware was whatever I could scrounge. There was no budget for a machine, so I gathered spare computer parts around the office and built the workstation myself. That left me running on salvaged, secondary hardware — and a hard ceiling of 12 GB of VRAM, which caps model size, image resolution, and runtime all at once.
- Cost drove the model choice. A larger model means more VRAM, which means buying hardware. Hosted API calls mean paying per run, every run, forever. Both were real money. A 5 GB model running locally on hardware I'd already assembled cost nothing per page, so that's what the pipeline was designed around.
Why this mattered to me: the VRAM ceiling turned into the most useful part of the project. Every choice — which model, what resolution to rasterize at, how much of a page to process at once — became a hardware budgeting problem. It was the first time my hardware coursework was the binding constraint on something I was building, rather than a separate subject.
How it works
The core design decision: don't ask a model to find the instruments. Find them geometrically, then ask the model only to read them.
1 · Geometry first
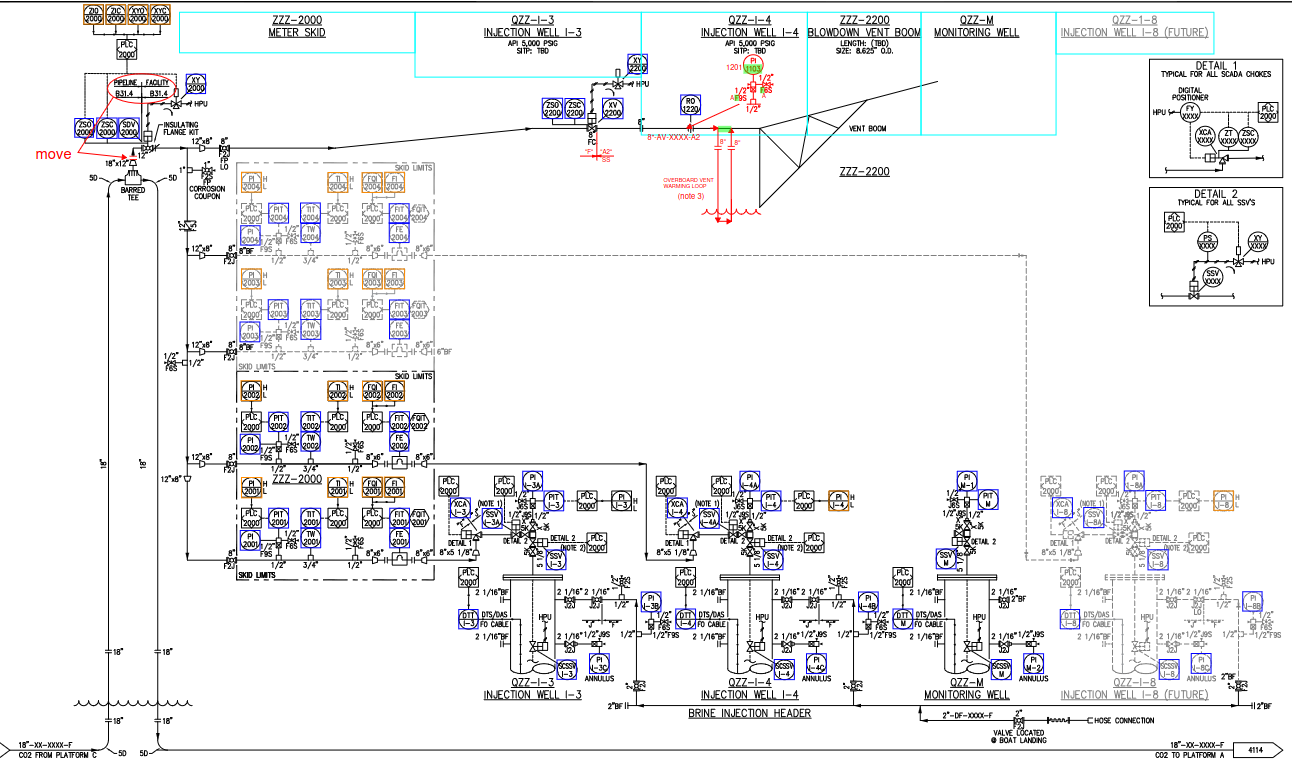
On a P&ID, an instrument is a circle. That's not a heuristic, it's the drafting standard. So instead of hoping a vision model spots every bubble on a dense drawing, the pipeline rasterizes each page and uses OpenCV to find contours of inked pixels, then tests each contour's circularity — the relationship between its enclosed area and its perimeter. A contour that scores high enough is, definitively, a circle.
Getting there took a stack of secondary filters, because drawings aren't drafted the same way from one client to the next. The same nominal shape comes through OpenCV differently depending on who drew it — one client's squares register with four clean corners, another's register with none at all. A single geometric threshold doesn't survive that, so the classification needed additional filtering layered on top to stay reliable across drawing sets.
This is the part that took the longest to get right, and it's the part I'd point to as the actual engineering. Going from a grid of color ratios at coordinates to a confident statement that there is a circle here, and its center is at these coordinates is a genuinely hard problem on a drawing that's dense with line work, hatching, and text.
2 · Read what's inside
Once a shape is located, a 5 GB vision model running under Ollama reads the tag text inside it. Constraining the model to a small, pre-cropped region instead of a full drawing is what makes it viable within the VRAM budget — and it's far more reliable than asking a model to both find and read at once.
3 · Resolve tags against a dictionary
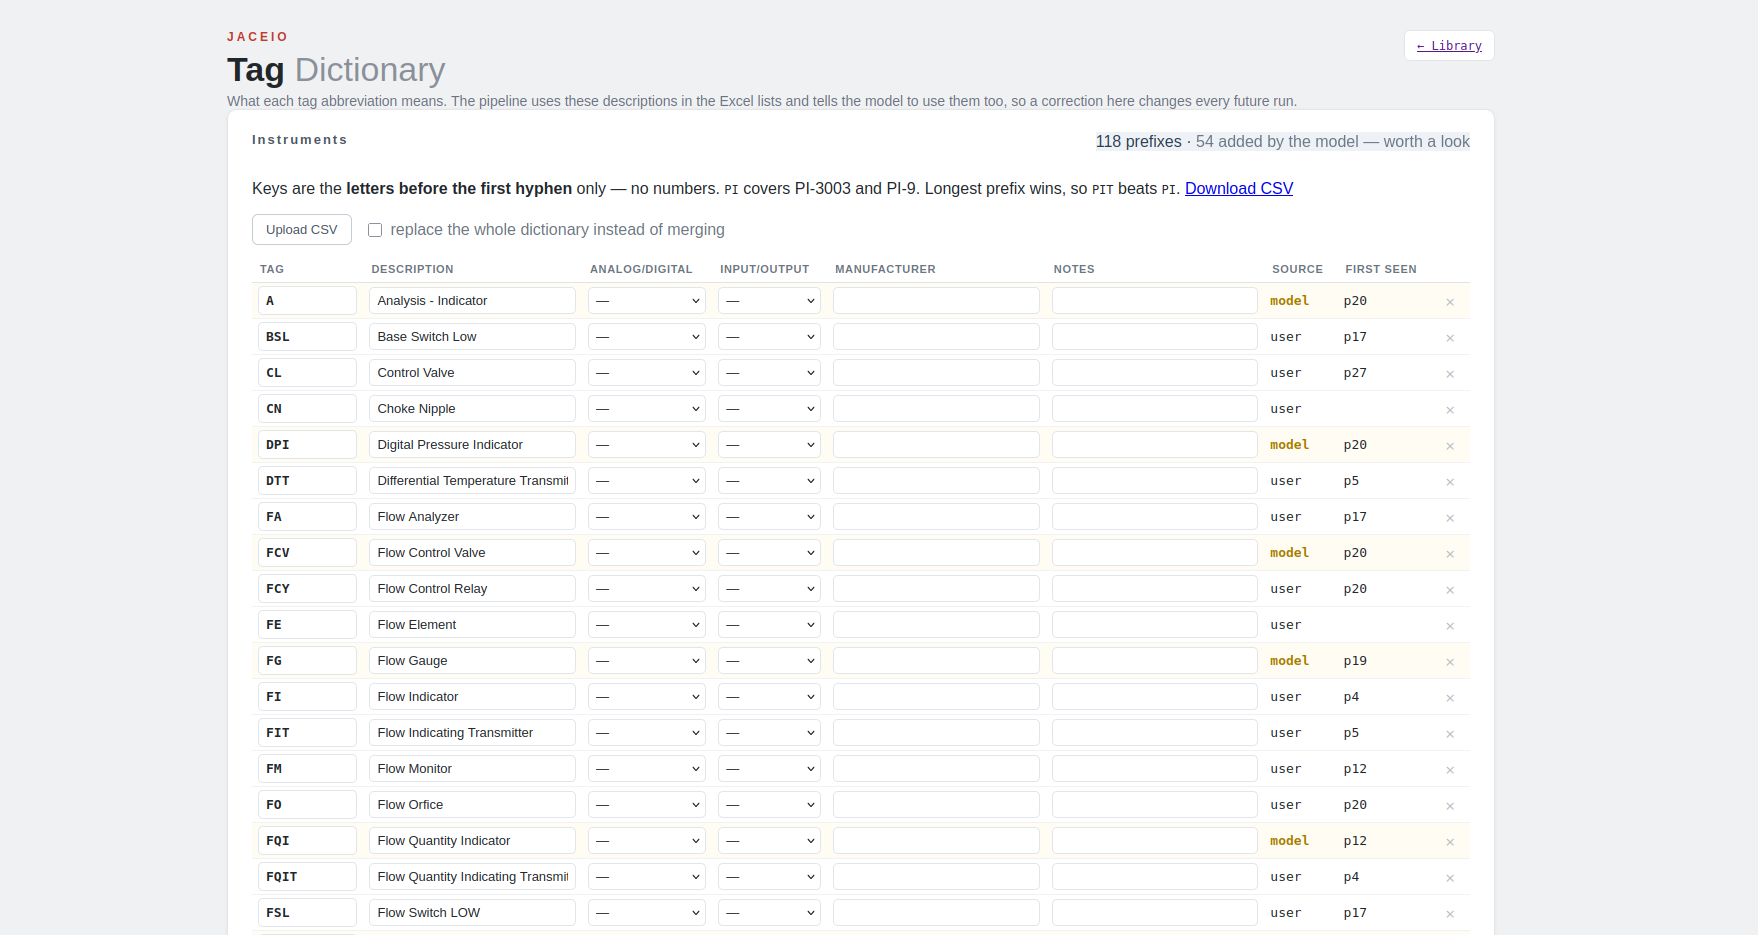
A tag prefix like PIT means "pressure indicating transmitter." Left to itself, the model would invent slightly different descriptions for the same prefix on different runs, and every project uses its own conventions anyway. So the pipeline keeps a tag dictionary: prefix, description, and metadata, editable by the engineer, persisted across runs, and used to prompt the model on future passes. The model can propose new entries when it meets a prefix it doesn't know, but a human decides whether the entry sticks.
4 · Emit the deliverables
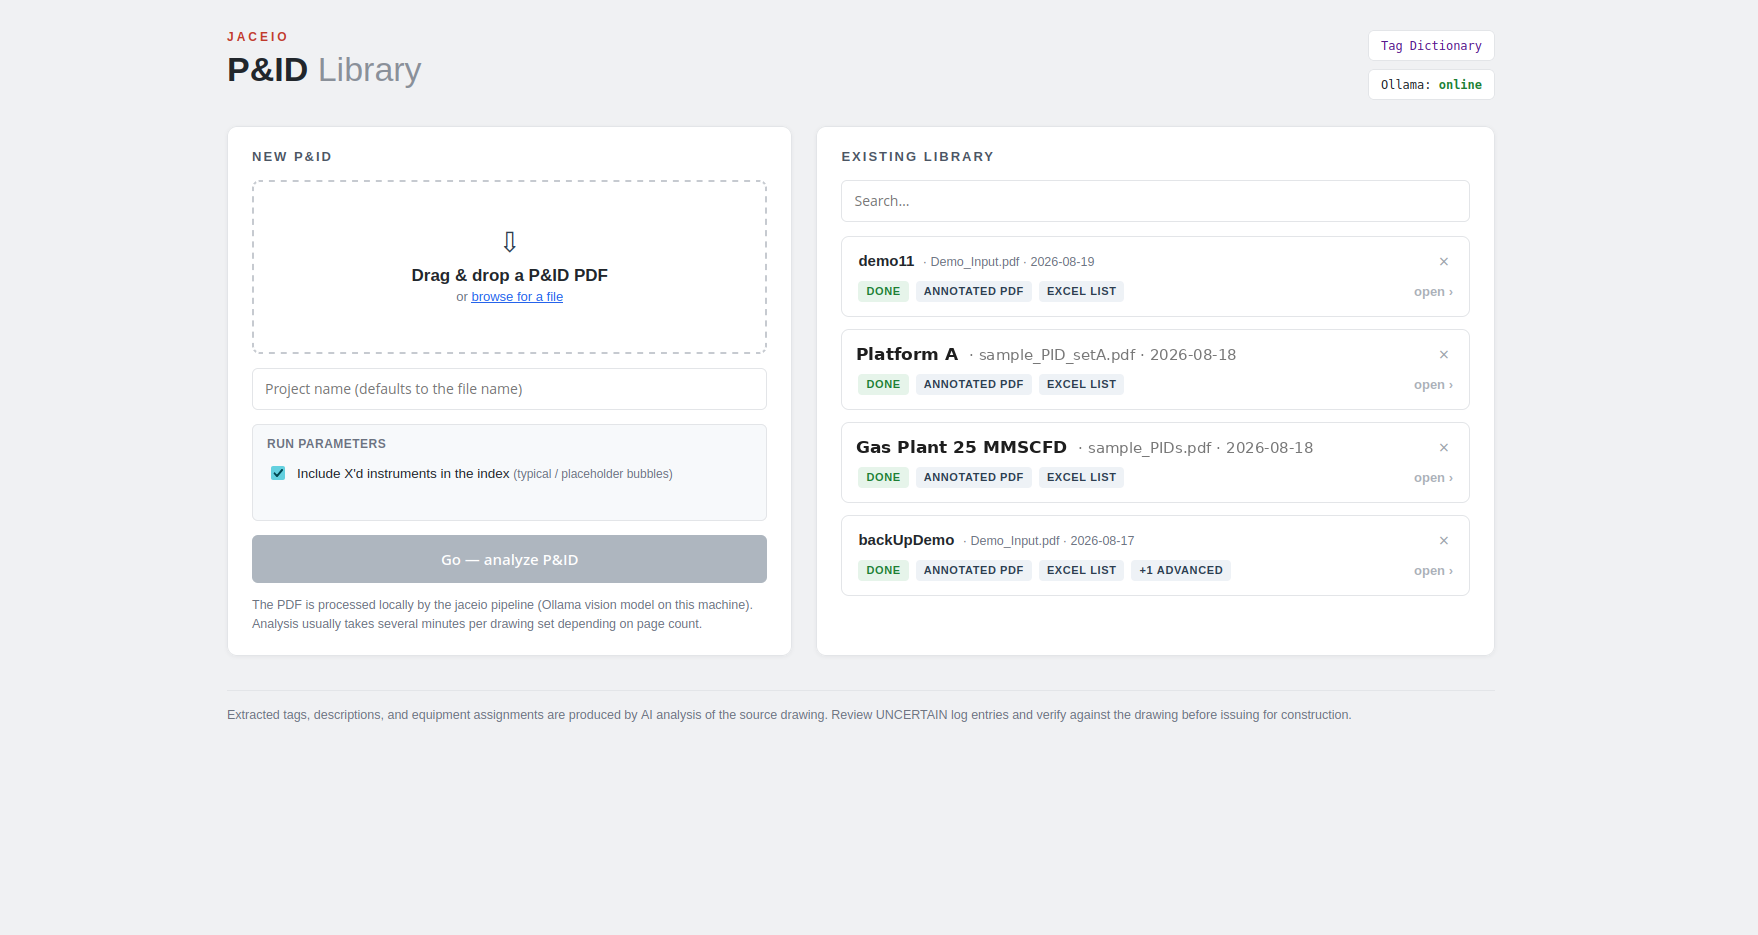
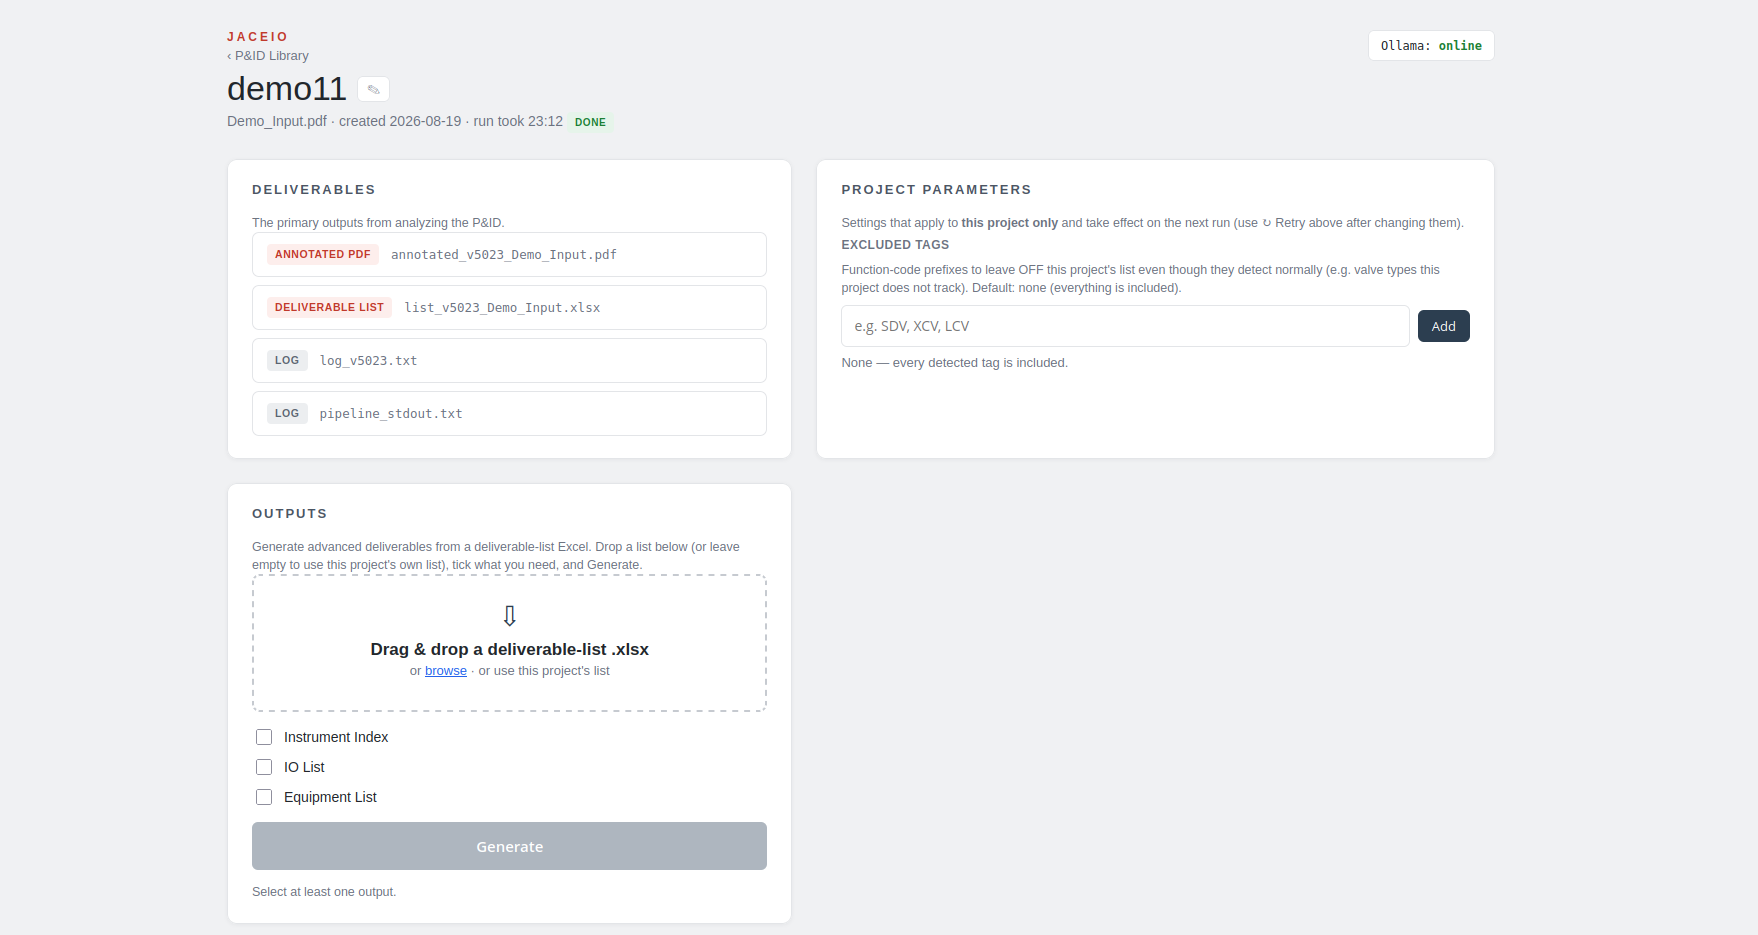
Output is an annotated PDF with every detection labeled, plus the Excel workbook the engineer actually needs — instrument list, panel list, equipment header list, tie-point list — in the format they already use.
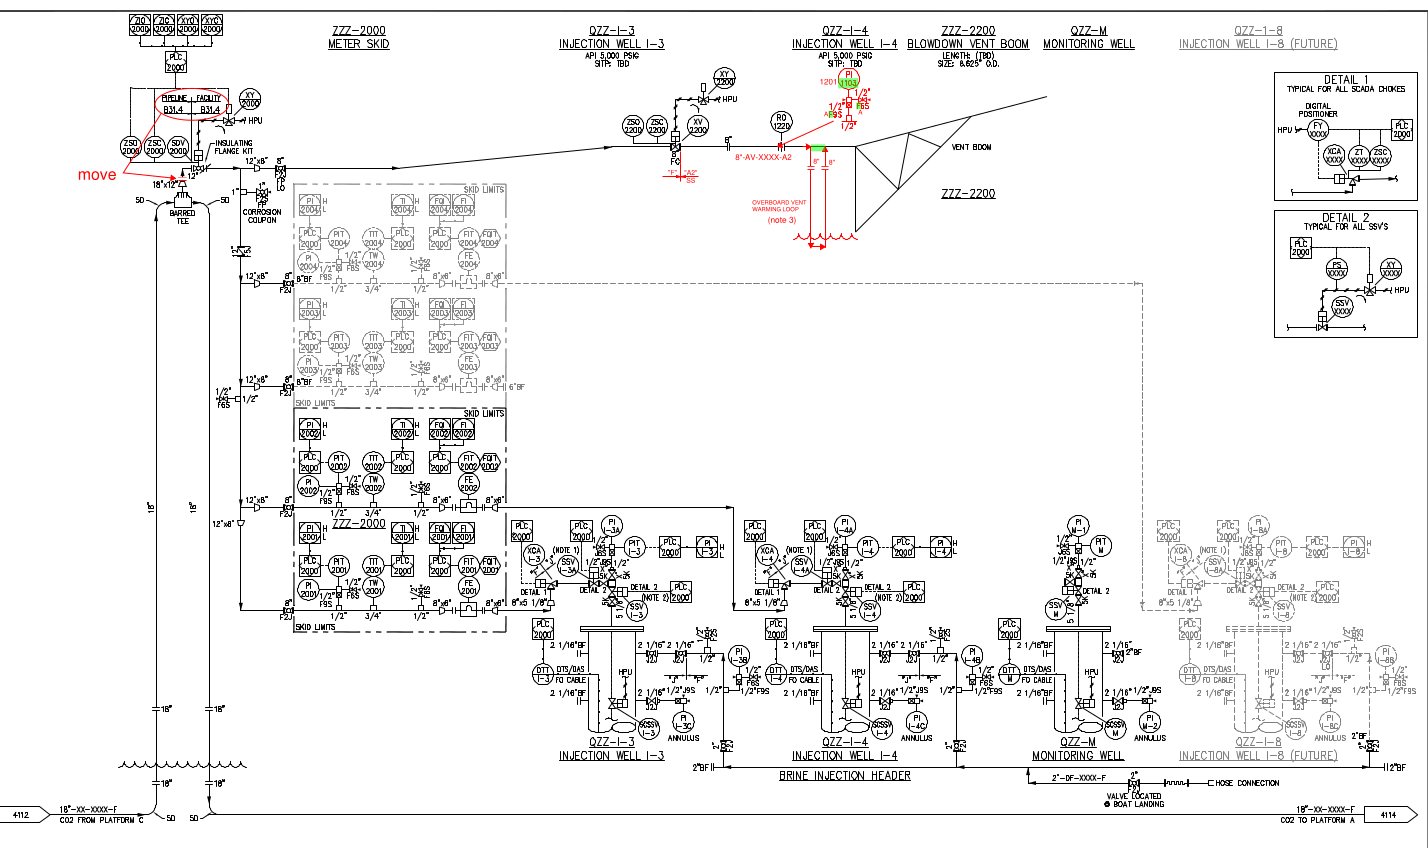
Dense drawings and markup
Sheet density varies enormously, and drawings in revision carry redline markup that means something. Detection has to hold up on the busiest sheets, and the color convention has to be respected rather than flattened.
The front end
All of the above is only useful if an engineer can actually drive it. This is what the validator sees.
Design decisions
The interesting part of this project wasn't getting it to work once. It was making the output trustworthy enough that an engineer would put their name on it.
Classical CV for detection, a model for interpretation
Geometric detection is deterministic and repeatable. Run it twice on the same drawing, get the same circles. A vision model asked to do detection gives you a different answer each time and no way to reason about why it missed something. Splitting the job means each half does what it's actually good at, and it's the only reason the whole thing fits in 12 GB.
A correctable dictionary instead of trusted output
The tag dictionary exists because model output alone wasn't good enough on its own terms — inconsistent descriptions across runs, no awareness of project-specific conventions. Making it editable turns a black box into something an engineer has real control over: correct a description once, and every future run on every project uses the corrected version.